It is every infrastructure manager’s wish to avoid ineffective activities and be able to prioritize the technical force on the actions that matter. Only that it is incredibly challenging to realize.
Tamping activities, for example, don’t always bring the intended outcome: in the best case, the voids under the sleepers will be removed and the ballast will be stabilized. In other cases, the improvement lasts only for a short period of time or there is no significant improvement at all. In the worst case, the tamping actions may have unintended negative consequences on other components.
As maintenance activities are directly linked to cost and availability, it is absolutely crucial for infrastructure managers to have transparency of the data on the decisions they’ve made – whether the actions were successful, for how long, and with which method.
As the current measurements on which maintenance decisions are based provide only the snapshot of the condition (and not the progress over time), the actions can only be based on limited data, e.g. measurements of only a few train passes. This could lead to a highly biased picture of the trackbed health, and naturally, some being over-or under-maintained.
In fact, often maintenance is done on many of the healthy assets due to a lack of insight into which assets actually require tamping. This could be not only inefficient but also shorten the lifetime of the ballast. A big limitation of the current practices is that there is not an adequate way to measure the actual effect of the tamping after it has been performed. Due to limited data, often it could be challenging to identify the reasons behind the maintenance quality and evaluate the best practices for a given asset.
The three key insights that infrastructure managers today are struggling to obtain for optimizing their maintenance activities are:
Which assets really need the action right now and how can they be prioritized?
Did the maintenance actions actually improve the trackbed health? And was the effect sustainable?
To be able to obtain the true picture of trackbed health and reflect the insights into optimizing maintenance actions, the trackbed conditions have to be continuously observed and analyzed. Our examinations below demonstrate the effect of the tamping actions based on real-life data and how continuous monitoring can help reveal the insights necessary to optimize the actions.
In this study, more than 100 tamping actions were analyzed (62% manual tampings, 23% machine tampings, and 15% unknown type). The tamped switches were equipped with the KONUX Predictive Maintenance System. The system measures, among other things, the level of vertical movement of the sleeper while a train passes over as an indicator for trackbed health.
The threshold of the vertical displacement set as a standard in this study is 3 mm – if the displacement is over this threshold, the trackbed health is indicated as poor, which is ‘red’ health state. ‘Yellow’ health means medium-level health and is an early warning before the threshold is crossed. Accordingly, ‘green’ health switches mean they are in good health.
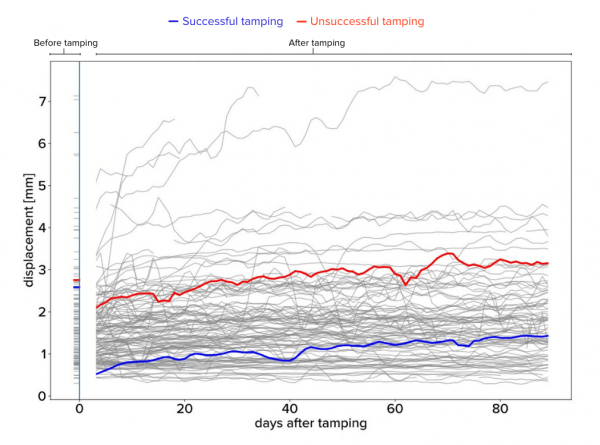
The evolution of the displacement after tamping of all the analyzed tamping actions is plotted below where each line represents one case. The x-axis represents the time after tamping and the y-axis is the degree of vertical displacement of the analyzed assets in millimeters.
The colored lines are examples of effective and ineffective tamping. To be considered effective, a maintenance action should meet three conditions: 1) the initial displacement after tamping should be reduced by at least 15%, 2) the average vertical displacement should be under the threshold of 3 mm, and 3) it should remain under the threshold for at least 60 days. Thus, the example case represented by the red line below is regarded as ineffective as the displacement exceeded 3 mm in just about 40 days.
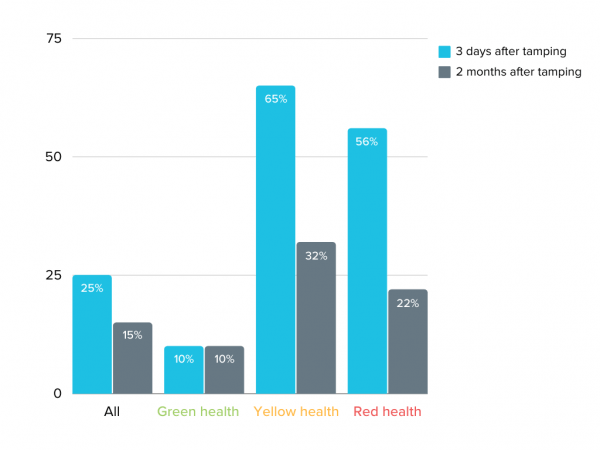
The effectiveness of the tamping actions was analyzed 3 days and 2 months after the maintenance activity. After 3 days, only 25% of the tamping actions were successful, and after 2 months only 15%.
The effectiveness is highly dependent on the initial trackbed health. For the switches that were already in good condition (green health) before tamping, only 10% were effective, even shortly after tamping. However, for the ones in yellow or red health state before tamping, the improvement was much more notable: around 60% of the tamping actions were effective after 3 days and 20-30% after 2 months.
The striking fact is that, given the low effectiveness of tamping on the switches in good condition, a large majority of the analyzed tamping actions were actually performed on them. As it is evident from the figure below, for both machine and manual tamping, a big majority was tamped although they were in good health.
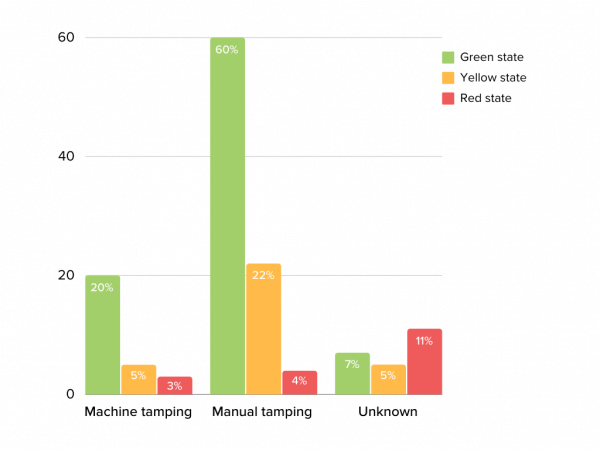
This might be justifiable for machine tamping as this is frequently done to correct the geometry of the switch rather than to correct the voids (and our system does not take into account the potentially positive effect of tamping on switch geometry). But it is hard to justify the manual tampings which are predominantly for correcting the voids. This tells us two possible explanations: either the manual tampings were done preventively on the green health assets, or the decisions were made based on inaccurate measurements and inspections – or both.
In comparing the effectiveness of manual versus machine tamping actions, the effect of machine tamping tends to be more significant and sustainable than manual tamping (for this evaluation, only the switches in yellow and red health state were counted).
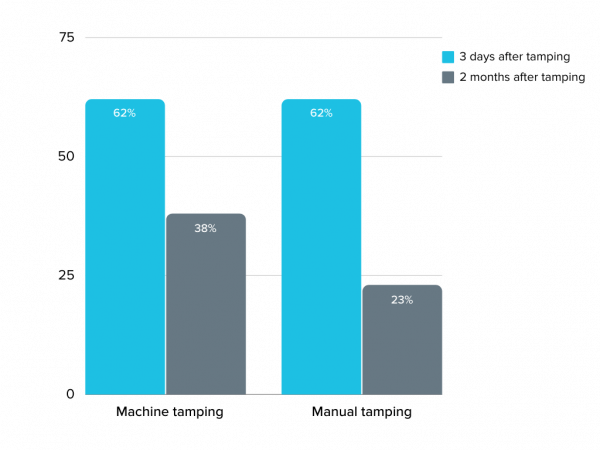
This, of course, does not justify the use of machine tamping at all times as there are cases of unsuccessful machine tampings and successful manual tampings (figure 8 below as an example). To obtain ‘true’ insights, rich data has to be combined to incorporate the trackbed health record over time, the effect of each tamping action, and the mode of the action.
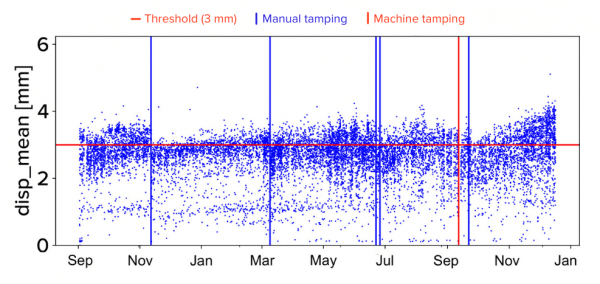
In the case Switch A below, six tamping actions were done within one year, where each dot represents the measured vertical displacement per train passing. None of them brought a sufficient and lasting improvement on the vertical displacement at the frog area. This indicates that further maintenance done in the same way will not improve the situation and a root cause analysis is necessary.
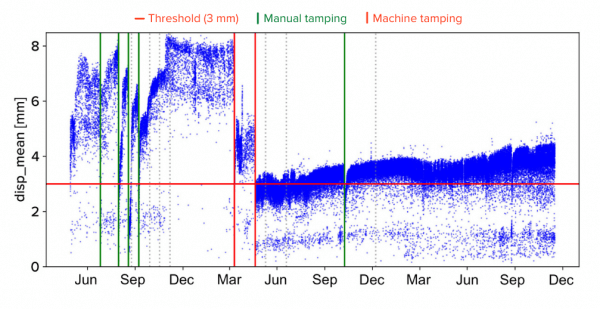
In another example, Switch B had severe problems with the trackbed support of the frog, with the displacement reaching nearly 8 mm. Only after 4 unsuccessful manual tampings and two succeeding machine tampings, the situation was finally improved. However, it still could not be regarded as successful because the displacement remained above the defined threshold. Half a year later, there was another manual tamping but it had a negligible effect.
The third case Switch C below was in a good condition until it was tamped pre-emptively. The tamping provoked an increased instability that had to be compensated by the second operation. The condition was brought back to under 3 mm but it could not reach the previous level. As a result, two operations were done with zero gain, contributing to excessive operating costs, increased wear of the ballast, and shortening the next maintenance cycle.
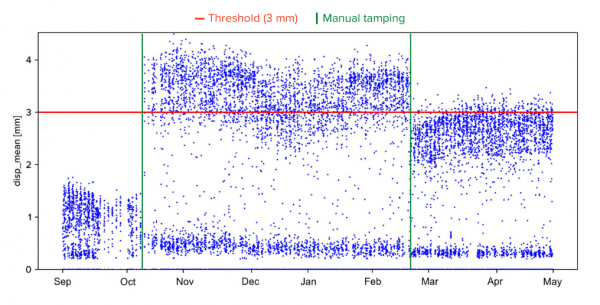
In the last case Switch D, the actions were performed successfully as can be seen from the clear decrease of the displacement below 3 mm. The manual tampings decreased the vertical movement well below 2 mm and stayed below the threshold for over 8 months before it was manually tamped again in January. This shows that manual tamping can be more effective than machine tamping depending on the situation and conditions of the switch.

The continuous stream of data instead of a snapshot of trackbed health provides an abundance of insights. It enables infrastructure managers to:
Evaluate the effect of maintenance activities in a matter of hours
Track the quality of tamping actions over a period of time to help assess and improve the long-term consequences
The insights coming from rich data can finally allow understanding the factors that influence the success of tamping actions – and going beyond, optimization of maintenance processes.

This article is the first article of the three Trackbed Health Research Study series.
Would like to know more about this article? Get in touch here.